Mastering Candlestick Charts in Crypto Trading: A Complete Guide
Understanding candlestick charts is a fundamental skill for anyone looking to trade cryptocurrencies effectively. These charts offer a visual representation of price movements over time, helping traders make informed decisions based on patterns and market psychology. In this article, we’ll dive deep into candlestick chart basics, common patterns, and how to apply them in real crypto trading scenarios.
What Are Candlestick Charts?
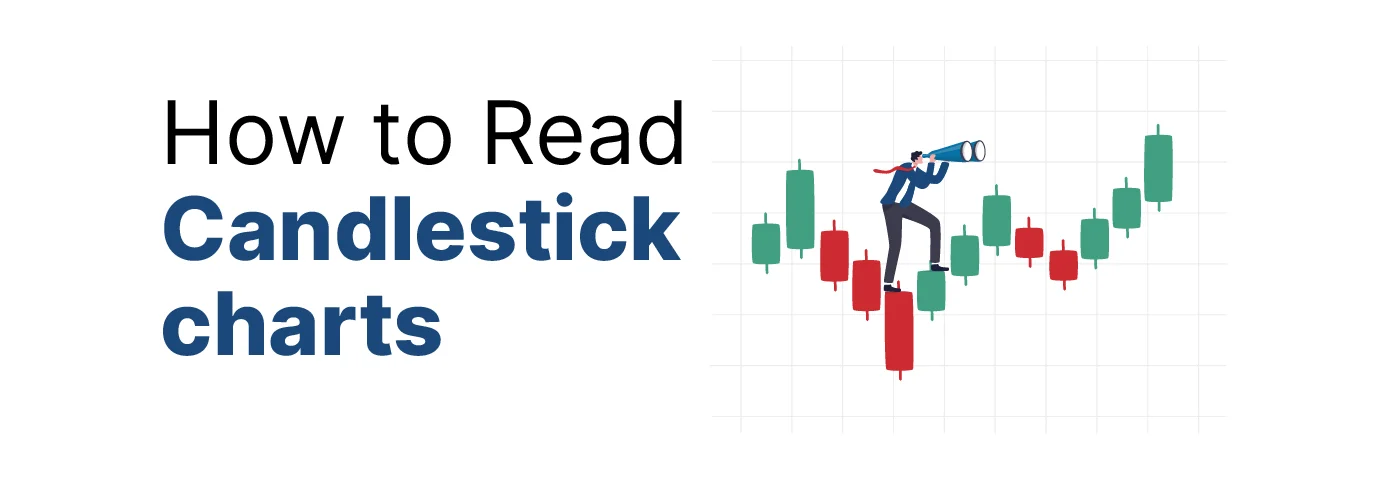
Candlestick charts are a type of financial chart used to describe price movements of an asset—such as Bitcoin or Ethereum—over time. Each “candlestick” represents a specific time frame (e.g., 1 minute, 1 hour, 1 day) and provides four critical pieces of data:
- Open Price – The price at which the asset started trading in the time frame.
- Close Price – The price at which the asset ended trading in the time frame.
- High Price – The highest price reached during that time.
- Low Price – The lowest price during that time.
Structure of a Candlestick:
- Body: The thick part between the open and close prices.
- Wicks (or shadows): The thin lines above and below the body, showing the high and low prices.
- Color: Typically, green/white means the price went up (close > open), and red/black means the price went down (close < open).
Why Candlestick Charts Matter in Crypto
Crypto markets are volatile and open 24/7. Candlestick charts help traders:
- Spot trends quickly
- Identify buying/selling pressure
- Recognize potential reversals
- Plan entry and exit points
Unlike line charts, which only show closing prices, candlestick charts provide much more nuanced information.
Popular Time Frames for Crypto Traders
- 1-minute & 5-minute charts – Used by scalpers.
- 15-minute & 1-hour charts – Day traders’ favorites.
- 4-hour & daily charts – Common among swing traders.
- Weekly & monthly charts – Used for long-term trend analysis.
Common Candlestick Patterns in Crypto Trading
Understanding these patterns can help traders anticipate future price movements.
Single Candlestick Patterns
- Doji
- Appearance: Very small or no body; wicks on both sides.
- Indicates: Indecision or potential reversal.
- Tip: Look for doji after strong trends for possible turning points.
- Hammer & Inverted Hammer
- Hammer: Small body with a long lower wick.
- Inverted Hammer: Small body with a long upper wick.
- Indicates: Potential reversal (bullish).
- Occurs After: Downtrends.
- Shooting Star & Hanging Man
- Shooting Star: Small body with a long upper wick (top of an uptrend).
- Hanging Man: Small body with a long lower wick (top of an uptrend).
- Indicates: Potential bearish reversal.
Multiple Candlestick Patterns
- Engulfing Patterns
- Bullish Engulfing: A small red candle followed by a larger green candle that completely engulfs it.
- Bearish Engulfing: A small green candle followed by a large red one.
- Strong Signal: Indicates strong buying or selling pressure.
- Morning Star & Evening Star
- Morning Star: Three-candle bullish pattern indicating trend reversal after a downtrend.
- Evening Star: Three-candle bearish pattern signaling a top.
- Three White Soldiers & Three Black Crows
- Three White Soldiers: Three consecutive green candles with higher closes.
- Three Black Crows: Three consecutive red candles with lower closes.
- Strength: Confirms strong bullish or bearish trend continuation.
Combining Candlesticks with Volume
Volume adds context. For example:
- A bullish engulfing candle with high volume is more reliable.
- A doji with low volume may suggest weak conviction.
Always pair candlestick analysis with volume indicators to improve accuracy.
Support and Resistance Zones
Candlestick patterns near support or resistance levels are especially powerful:
- A bullish pattern near support may signal a bounce.
- A bearish pattern near resistance may indicate a rejection.
Using candlesticks in conjunction with trendlines, moving averages, or Fibonacci retracement levels can further improve reliability.
Candlestick Traps to Avoid
- Ignoring the Bigger Picture: One candle doesn’t make a trend.
- Low Time Frame Noise: On 1-minute charts, many false signals appear.
- Trading Without Confirmation: Always wait for the next candle to confirm the pattern.
- Forcing Patterns: Don’t try to fit the pattern to match your bias.
Real-World Example: Bitcoin Reversal Using Candlesticks
Let’s say Bitcoin drops from $30,000 to $28,000. On the 4-hour chart:
- A hammer forms at the $28,000 support level.
- The next candle is a strong green bullish candle.
- Volume increases.
This combination suggests a likely reversal. A trader might go long with a stop-loss below $27,800 and a take-profit at $30,500.
Best Tools for Viewing Candlestick Charts
- TradingView – Industry favorite with customizable candlestick charts and indicators.
- Binance/Bybit/OKX – Built-in candlestick charts in trading dashboards.
- CoinMarketCap Pro – For price action enthusiasts tracking multiple coins.
Bonus: Candlestick Cheat Sheet for Beginners
| Pattern | Signal | Trend Direction |
|---|---|---|
| Hammer | Bullish Reversal | Downtrend |
| Shooting Star | Bearish Reversal | Uptrend |
| Engulfing | Trend Reversal | Any |
| Doji | Indecision | Any |
| Morning Star | Bullish Reversal | Downtrend |
| Evening Star | Bearish Reversal | Uptrend |
Combining Candlesticks with Indicators
Enhance your strategy by combining candlestick analysis with:
- RSI (Relative Strength Index) – Confirms overbought/oversold conditions.
- MACD – Confirms trend reversals or continuations.
- Moving Averages – Filters trades in the direction of the larger trend.
Conclusion
Candlestick charts are one of the most powerful tools in a crypto trader’s arsenal. They provide deep insight into market psychology, buying/selling pressure, and potential price movements. Whether you’re scalping or swing trading, mastering candlestick patterns can significantly improve your decision-making.
However, candlesticks are not magic. Always consider them as part of a broader strategy that includes risk management, indicators, and market context. With time, discipline, and practice, you’ll gain the ability to “read the story” behind each candle—and that’s where real trading skill begins.


