How to Use Fibonacci Retracements in Forex: A Detailed Guide
Fibonacci retracements are one of the most popular tools in technical analysis for identifying potential levels of support and resistance in a trending market. The concept is based on the idea that markets tend to retrace a predictable portion of a move, after which they often continue in the original direction. Here’s how you can use Fibonacci retracements in Forex trading:
What is Fibonacci Retracement?
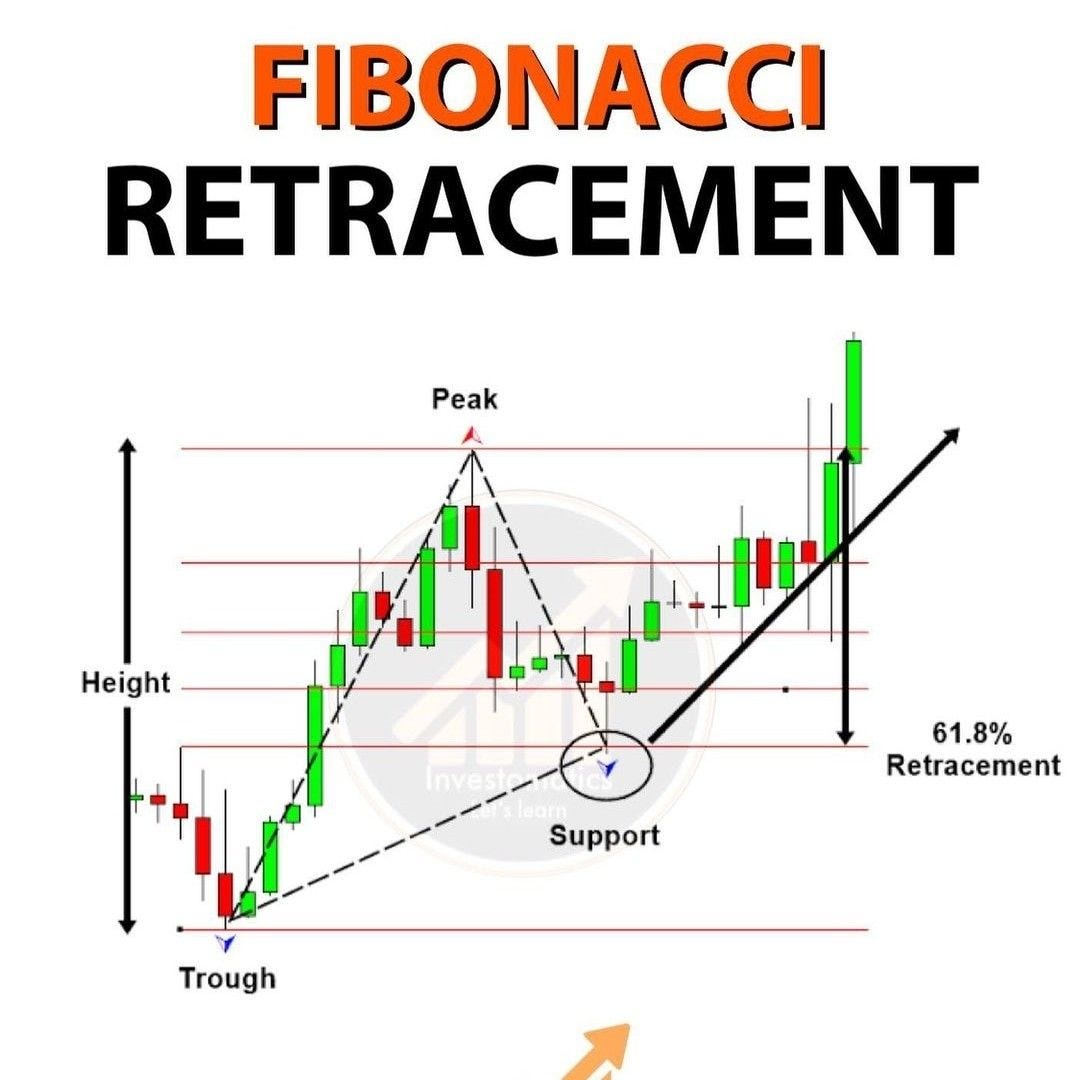
Fibonacci retracement is a tool used by traders to identify key levels at which a market might retrace before continuing in its original trend. The tool uses horizontal lines to represent areas of support or resistance at key Fibonacci levels before the price continues in the original direction.
The key Fibonacci retracement levels are:
- 23.6%
- 38.2%
- 50% (not a Fibonacci number, but still widely used)
- 61.8%
- 78.6% (less common, but some traders consider it)
These levels are based on the Fibonacci sequence, which starts with 0 and 1, and each successive number is the sum of the previous two. The ratios derived from the sequence are believed to be reflective of natural phenomena, making them important in financial markets.
How to Use Fibonacci Retracements in Forex Trading
Step 1: Identify a Strong Trend
The first step is to find a strong trend, either bullish (upward) or bearish (downward). Fibonacci retracement works best in trending markets, as it helps traders identify potential areas for retracement and continuation.
- Uptrend: A strong bullish move followed by a retracement down.
- Downtrend: A strong bearish move followed by a retracement up.
Step 2: Select the Fibonacci Tool
Most Forex trading platforms (like MetaTrader 4 or MetaTrader 5) have a built-in Fibonacci retracement tool.
To use the tool:
- Select the Fibonacci retracement tool from your charting platform.
- In an uptrend, click at the lowest point of the trend and drag it to the highest point.
- In a downtrend, click at the highest point and drag it to the lowest point.
- Fibonacci levels will automatically appear as horizontal lines on the chart.
Step 3: Look for Key Fibonacci Levels
Once you’ve drawn the Fibonacci retracement levels, you’ll see several horizontal lines on the chart at various retracement levels. These lines represent potential levels where the price could retrace.
- 23.6%: Typically, a shallow retracement, often indicating a continuation of the trend.
- 38.2%: This level is a key support/resistance level that often marks a deeper retracement.
- 50%: This is not a Fibonacci number but is used by many traders as a significant level for price retracement.
- 61.8%: Often regarded as the most important Fibonacci level, this is a deep retracement that can be a strong support or resistance.
- 78.6%: This is a more extreme retracement and could signal that the trend might reverse if the price stalls at this level.
Step 4: Confirmation with Other Indicators
Fibonacci retracement levels should never be used in isolation. To increase the probability of success, use other technical indicators to confirm the potential reversal or continuation at the Fibonacci levels.
Here are a few indicators to combine with Fibonacci retracement:
- RSI (Relative Strength Index): Can help confirm whether a level is overbought or oversold.
- MACD (Moving Average Convergence Divergence): Helps identify momentum shifts.
- Moving Averages: Can confirm trend direction and offer additional support/resistance levels.
- Candlestick Patterns: Look for reversal candlestick patterns (like pin bars or engulfing patterns) at Fibonacci levels for confirmation.
Step 5: Monitor the Price Action at Fibonacci Levels
Once price approaches one of the Fibonacci retracement levels, monitor the price action for signs of a reversal or continuation. For example:
- Bounce: If the price bounces off a Fibonacci level, this could indicate that the trend is resuming.
- Breakthrough: If the price breaks through a Fibonacci level with momentum, it might signal a trend reversal.
Step 6: Set Entry, Stop Loss, and Take Profit Levels
Once you’ve identified a potential reversal or continuation at a Fibonacci level, plan your trade:
- Entry Point: Enter the trade when you see a confirmation signal such as a candlestick pattern or other indicator signals.
- Stop Loss: Place your stop loss just beyond the next Fibonacci level in the direction of the trend (to avoid being stopped out by market noise).
- Take Profit: Set your take profit target at the next Fibonacci level or based on a risk-to-reward ratio you’re comfortable with (e.g., 1:2).
Example of Using Fibonacci Retracement in Forex
- Uptrend Example: Suppose the EUR/USD currency pair is in an uptrend, and the price has risen from 1.1000 to 1.2000.
- You draw the Fibonacci retracement from the low (1.1000) to the high (1.2000).
- The key Fibonacci levels will appear at 1.1880 (23.6%), 1.1760 (38.2%), 1.1500 (50%), and 1.1240 (61.8%).
- As the price retraces to 1.1760 (38.2% level), you might see the price stabilize and reverse back up, signaling a continuation of the uptrend.
- You can enter the trade at 1.1760, place a stop loss below 1.1700, and set a take profit at 1.2000 (the previous high).
- Downtrend Example: Now, let’s consider the GBP/USD is in a downtrend, moving from 1.3500 to 1.3000.
- You would draw the Fibonacci retracement from the high (1.3500) to the low (1.3000).
- The key Fibonacci levels would be at 1.3100 (23.6%), 1.3200 (38.2%), and 1.3300 (50%).
- As the price retraces to 1.3200, you may notice a bearish candlestick pattern, suggesting a continuation of the downtrend.
- You can enter at 1.3200, set a stop loss above 1.3250, and aim for a take profit near 1.3000 (the previous low).
Key Tips for Using Fibonacci Retracement Effectively
- Use on Larger Time Frames: Fibonacci levels work best on higher time frames (like H4, Daily, or Weekly) for more significant trends.
- Multiple Levels: The more Fibonacci levels that coincide with support/resistance, the stronger that level becomes.
- Market Conditions: Use Fibonacci retracement in trending markets, not in ranging or sideways markets.
Final Thoughts
Fibonacci retracement is a powerful tool that, when used properly, can help you identify potential levels for entries, exits, and stop losses. However, it is important to use it in combination with other indicators and confirm the price action at key levels to maximize your chances of success. Like any tool, practice and experience are key to using Fibonacci retracement effectively in your Forex trading strategy.


